Introduction
Website speed is no longer just a luxury for user experience; it is a direct Google ranking factor. Through a framework called Core Web Vitals, search engines evaluate exactly how fast, responsive, and stable your web pages are during real-world loading sequences.
For WordPress users, looking at these complex speed charts can be intimidating. However, understanding how to read and interpret these optimization metrics is the first step to unlocking faster loading times and higher search rankings. In this tutorial, we will break down the three primary metrics of Core Web Vitals and explain how to fix them using free performance tools.
The Three Pillars of Core Web Vitals
Google focuses on three distinct metrics to measure page load performance. If your site falls into the “Poor” or “Needs Improvement” categories for any of these, your organic reach could suffer.
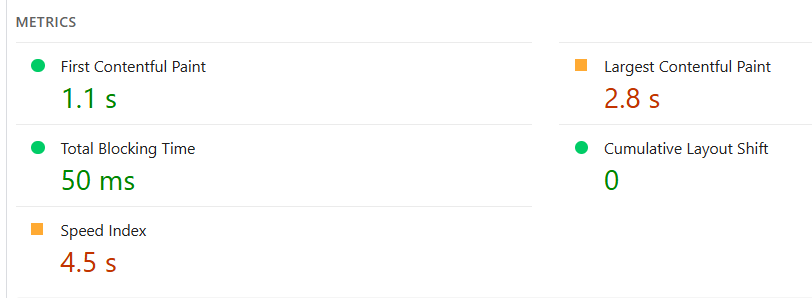
1. Largest Contentful Paint (LCP)
LCP measures loading performance. Specifically, it tracks how long it takes for the main content of a webpage (usually a large hero image, banner, or block of heading text) to become visible to the user.
- Good Score: Under 2.5 seconds.
- Common Culprits: Heavy uncompressed images, slow server response times, or render-blocking JavaScript files.
2. Interaction to Next Paint (INP)
INP measures a page’s overall responsiveness to user interactions, such as clicking a link, tapping a button, or interacting with a menu dropdown. It tracks the delay between the user’s action and the visual update on the screen.
- Good Score: 200 milliseconds or less.
- Common Culprits: Heavy background scripts, massive page-builder layouts, or poorly optimized tracking codes.
3. Cumulative Layout Shift (CLS)
CLS measures visual stability. Have you ever tried to click a link on a mobile device, only for the page to suddenly shift down, causing you to misclick an accidental element? That movement is a layout shift.
- Good Score: Less than 0.1.
- Common Culprits: Images without specified width and height dimensions, dynamic ad units without reserved space, or custom web fonts loading late.
Step-by-Step Guide to Diagnosing Your Site
Step 1: Run a Test on PageSpeed Insights
Navigate to Google’s official, free tool: PageSpeed Insights. Enter your website URL and click analyze. The platform will pull real user experience data (if available) alongside a simulated “Lighthouse” technical audit for both mobile and desktop environments.
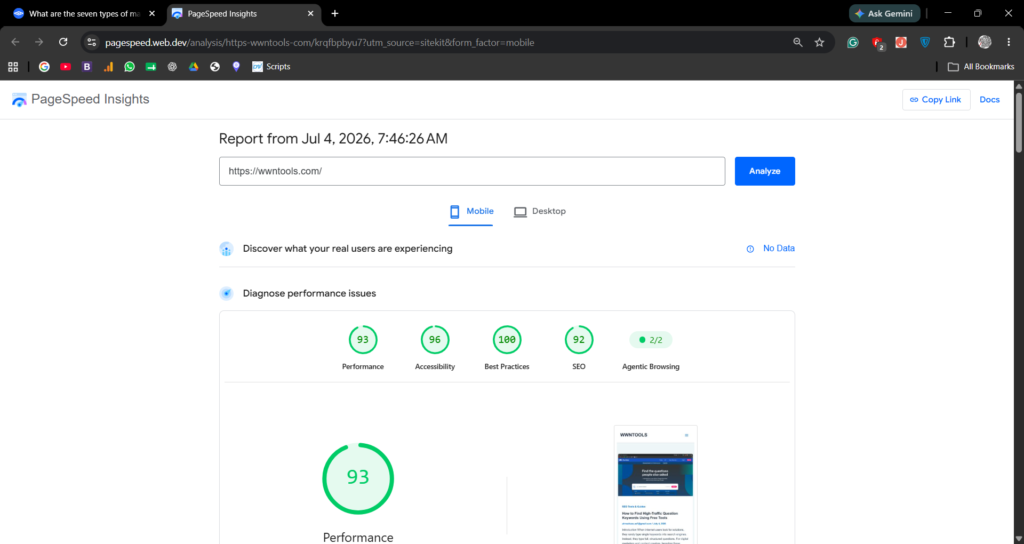
Step 2: Pinpoint the Performance Bottlenecks
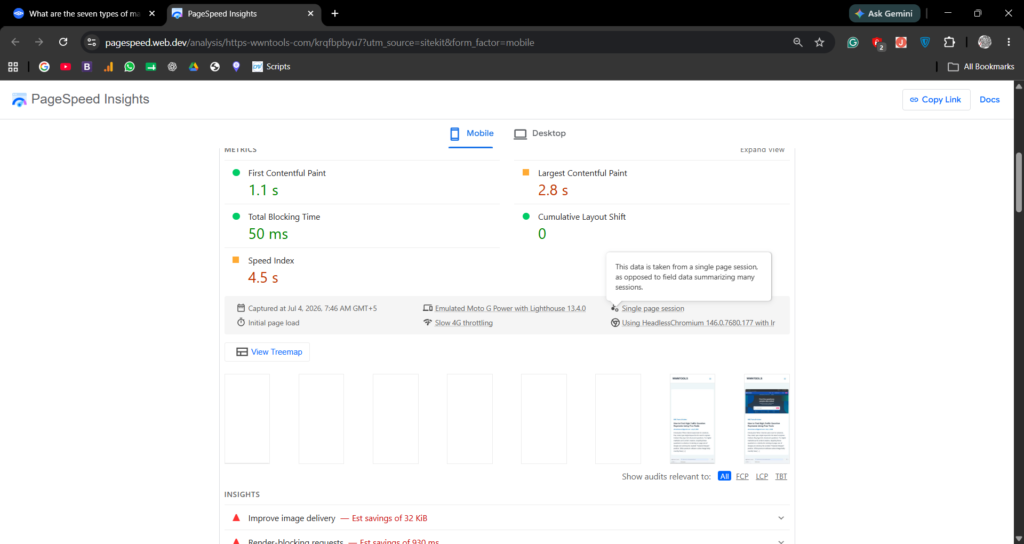
Scroll down past the color-coded scoring circles to the Diagnostics section. Google will flag the exact elements slowing down your system. Look for specific phrases like “Properly size images,” “Eliminate render-blocking resources,” or “Reduce unused JavaScript.”
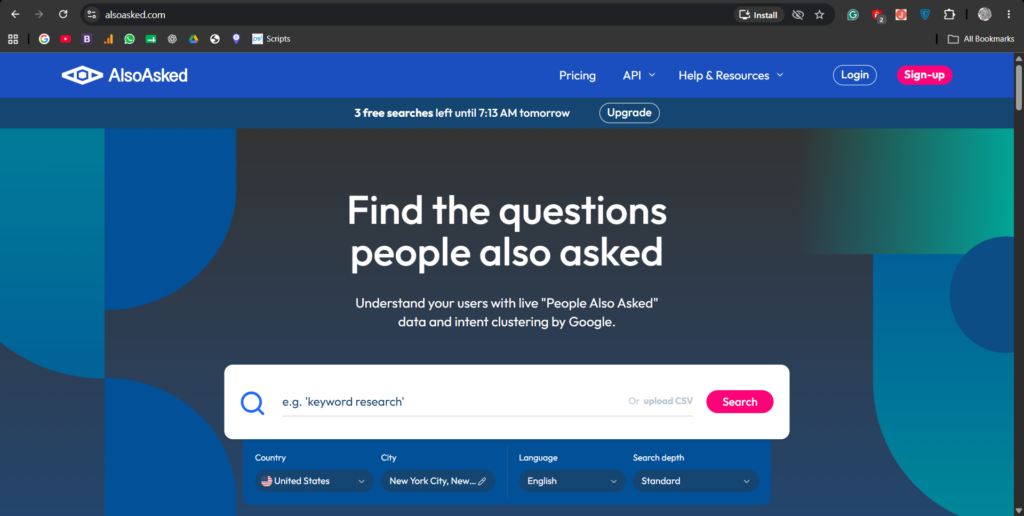
Also Read: How to Find High-Traffic Question Keywords Using Free Tools
Three Free Ways to Fix Your Core Web Vitals in WordPress
Fortunately, you do not need to be a senior software engineer to patch these errors in WordPress. You can optimize your scores using these free techniques:
- Install an Image Optimization Plugin: Use free tools like LiteSpeed Cache or Smush to compress raw image uploads automatically and enable lazy loading. This lightens the file load, rapidly accelerating your LCP score.
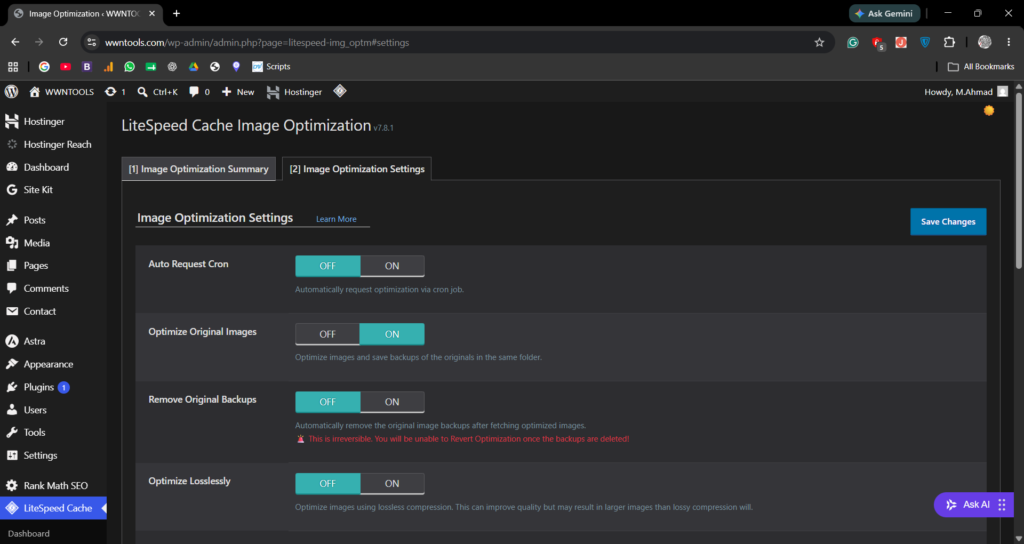
- Define Image Dimensions: When adding custom icons or graphics to your layout, ensure you manually enter the width and height attributes within the code block or layout manager. This locks the element size, eliminating CLS layout shifting.
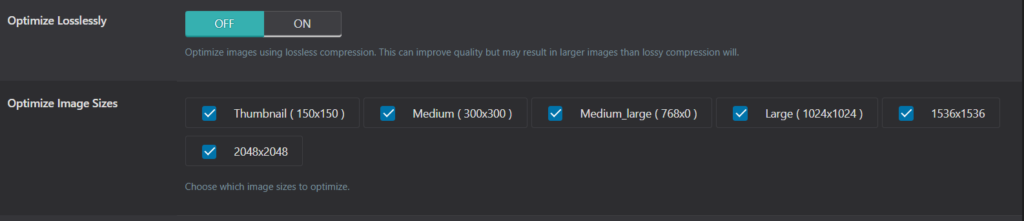
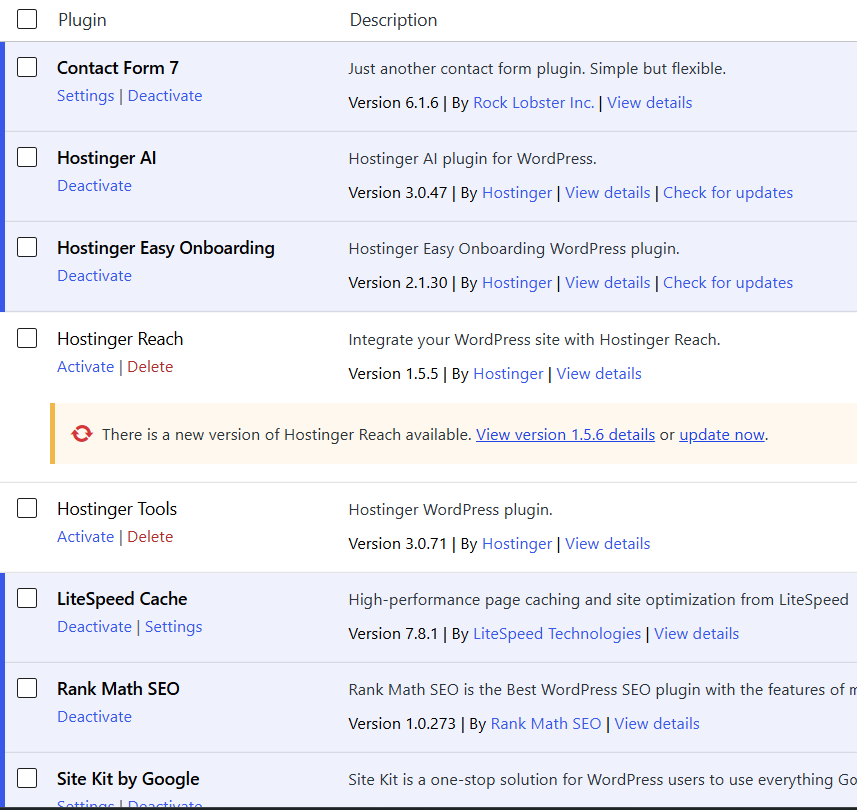
- Minimize Active Plugins: Every plugin you activate on WordPress injects new scripts into your header files. Deactivate and completely delete any tools you are not using to lower background script processing times.
Conclusion
Optimizing your website speed does not require expensive site rebuilds. By tracking your Core Web Vitals on PageSpeed Insights and implementing basic asset compression, you can keep your site running smoothly for both human readers and search crawlers. Regularly audit your speed data to ensure your performance remains flawless as your library expands.
Pingback: How to Use Plagiarism Checkers to Protect Your Site from Content Scraping – WWNTOOLS
Pingback: How to Read Image Compression Metadata to Improve Page Loading Speed – WWNTOOLS
Pingback: How to Clean WordPress Database Overhead to Improve Server Fetch Speeds - WWNTOOLS